Role: Lead Designer & Frontend Engineer
Project Overview
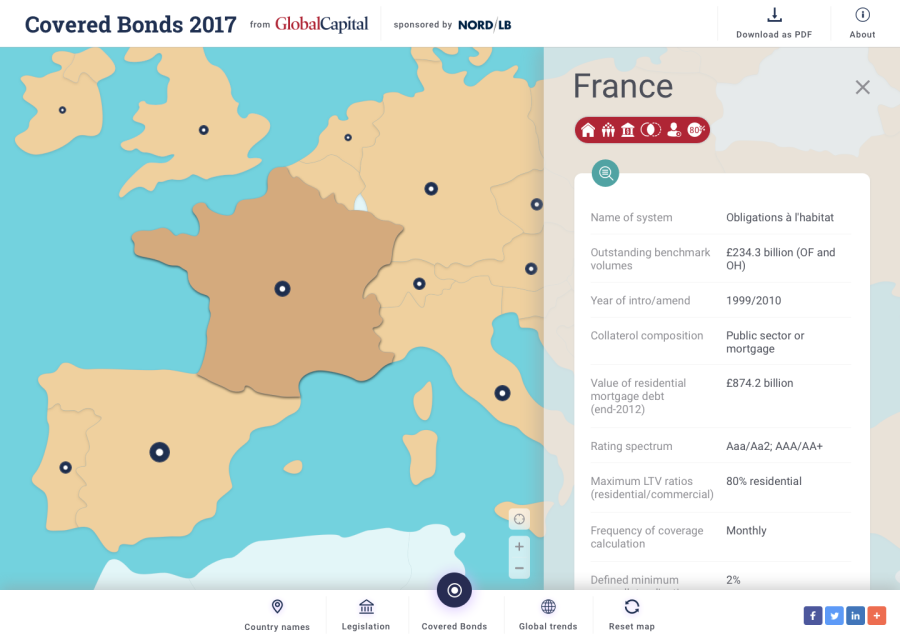
Global Capital’s printed covered bonds maps were a staple reference for clients, providing clear insights into international capital markets. The challenge was to bring this traditionally static resource into a dynamic, interactive digital format, while maintaining the clarity and reliability that clients had come to expect.
I was responsible for leading the visual design & front-end development, and designing a workflow that allowed the editorial team to manage data efficiently, without heavy reliance on backend resources.
Strategic Approach
The project required balancing several constraints:
- Data Complexity: The map pulled from multiple sources, some inconsistent or loosely structured.
- Ease of Use: Editors needed a way to update the map without technical intervention.
- Interactive Visualisation: Users should be able to explore data dynamically.
- Display Requirements: The map would often be shown on large screens in client environments, so legibility and clarity were critical.
To address these challenges, we:
- Used the Google Sheets API to allow non-technical staff to manage and update data.
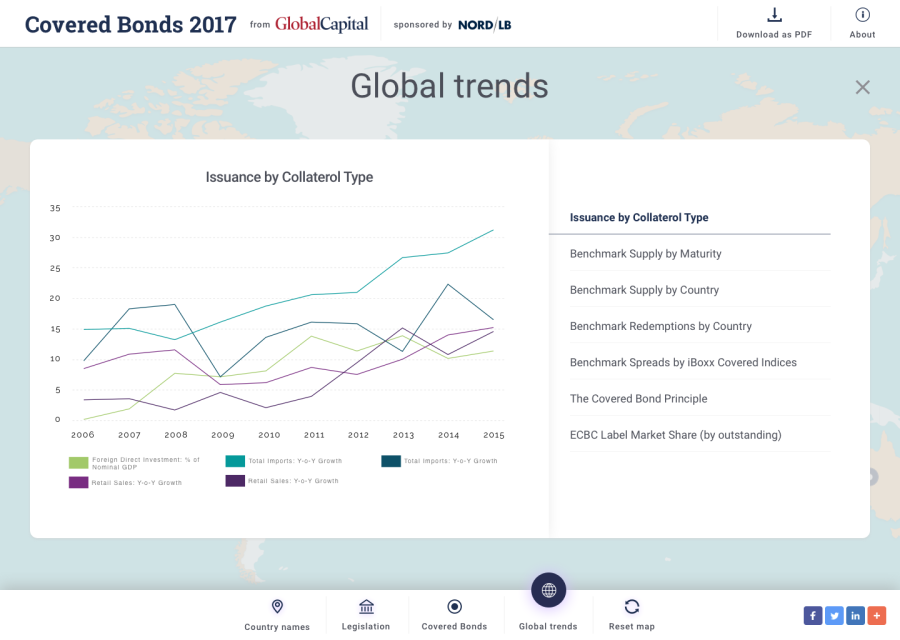
- Leveraged D3.js and C3.js to create dynamic, interactive visualisations.
- Built the interface on Google Maps API to provide geographic context and interactivity.
- Designed layouts with large, readable fonts and colour-coded markers suitable for screen and print reference.
Implementation & Deliverables
Key deliverables included:
- An interactive digital map integrating multiple data sources.
- Dynamic charts and graphs that enhanced understanding of complex data.
- A simple editorial workflow via Google Sheets, reducing content management overhead.
- Responsive design optimised for both desktop and large-screen displays.
Outcome
The Covered Bonds Map became a reliable, interactive tool for Global Capital’s clients, preserving the utility of the printed maps while enhancing accessibility and engagement. By integrating existing data sources, simplifying editorial updates, and designing for large-screen readability, the project demonstrated the value of thoughtful engineering and design in transforming a legacy resource into a modern, user-friendly digital product.